
|
| VIRGINIA COAST RESERVE LONG-TERM ECOLOGICAL RESEARCH |
Site HOGI, Month FEB, Year 1991 |

| 
|
| Day of Month | Precip (mm) | Max Temp. oC | Min Temp. oC | Mean Temp. oC | Wind Speed (m/s) | Wind Dir (deg.) | Vapor Press. (mb) | Solar Rad. KJ/m2 | PAR uE/m2 |
|---|---|---|---|---|---|---|---|---|---|
| 1 | 0.00 | 8 | -3 | 2.2 | 2.00 | 358 | 1.49 | 12923 | 29524 |
| 2 | 0.00 | 12 | 2 | 6.9 | 2.60 | 196 | 2.01 | 12912 | 29946 |
| 3 | 0.00 | 18 | 4 | 8.6 | 1.47 | 215 | 2.18 | 13181 | 29717 |
| 4 | 0.00 | 18 | 2 | 9.2 | 0.97 | 186 | 3.46 | 13355 | 30076 |
| 5 | 0.00 | 16 | 1 | 8.6 | 1.06 | 195 | 5.94 | 11903 | 28028 |
| 6 | 0.00 | 14 | 8 | 10.8 | 1.14 | 210 | 10.53 | 3033 | 8371 |
| 7 | 8.30 | 11 | 9 | 9.9 | 1.36 | 184 | 9.90 | 1579 | 4481 |
| 8 | 0.30 | 11 | 4 | 8.2 | 3.53 | 7 | 7.63 | 3753 | 9258 |
| 9 | 0.00 | 11 | 1 | 6.2 | 2.10 | 342 | 4.42 | 13381 | 29806 |
| 10 | 0.00 | 9 | 0 | 4.7 | 1.95 | 342 | 6.47 | 9114 | 21024 |
| 11 | 0.00 | 8 | -0 | 3.8 | 2.14 | 352 | 3.04 | 9264 | 20890 |
| 12 | 0.00 | 2 | -5 | -0.9 | 3.65 | 340 | 2.10 | 13155 | 29746 |
| 13 | 0.80 | 13 | -1 | 7.2 | 2.32 | 212 | 6.55 | 8222 | 19405 |
| 14 | 2.70 | 18 | 7 | 11.6 | 2.93 | 227 | 10.54 | 13184 | 29278 |
| 15 | 0.00 | 9 | -2 | 3.7 | 4.45 | 284 | 4.66 | 12021 | 27276 |
| 16 | 0.00 | -1 | -6 | -3.2 | 4.58 | 301 | 2.29 | 14739 | 33574 |
| 17 | 0.30 | 8 | -2 | 2.8 | 2.36 | 242 | 4.52 | 8780 | 21501 |
| 18 | 2.40 | 8 | 4 | 6.3 | 1.61 | 148 | 8.76 | 2381 | 6269 |
| 19 | 1.20 | 13 | 8 | 10.3 | 3.10 | 195 | 11.89 | 4889 | 11630 |
| 20 | 0.80 | 19 | 10 | 13.7 | 3.02 | 224 | 14.38 | 4407 | 10873 |
| 21 | 0.00 | 12 | 2 | 8.1 | 1.37 | 151 | 8.86 | 11747 | 27300 |
| 22 | 0.00 | 19 | 7 | 12.3 | 2.26 | 248 | 10.15 | 12570 | 29387 |
| 23 | 0.00 | 10 | 1 | 3.9 | 5.25 | 31 | 4.73 | 7226 | 17752 |
| 24 | 4.00 | 8 | 2 | 5.9 | 4.02 | 38 | 8.41 | 2978 | 8051 |
| 25 | 0.00 | 12 | 5 | 7.4 | 1.94 | 8 | 9.44 | 10620 | 23883 |
| 26 | 3.90 | 6 | 1 | 3.8 | 3.44 | 351 | 7.16 | 3961 | 9668 |
| 27 | 0.00 | 8 | 0 | 3.8 | 3.01 | 289 | 4.92 | 16493 | 37141 |
| 28 | 0.00 | 13 | 3 | 7.9 | 2.22 | 193 | 8.12 | 15413 | 35159 |
| Mon. Tot. Precip. 24.7 mm | Mean wind vel. 2.565 m/s |
| Mon. Mean Temp. 6.6 deg. C | Wind dir 301 deg |
| Mean Max. Temp. 11.2 deg. C | Mean Min. Temp. 2.3 deg. C |
| Extreme Max. Temp 18.8 deg. C | Mean vapor press 6.59 mb |
| Extreme Min. Temp -5.7 deg. C | Total Solar Rad 267185 KJ/sq. m |
| Total photosyn. 619014 uEin/sq.m |
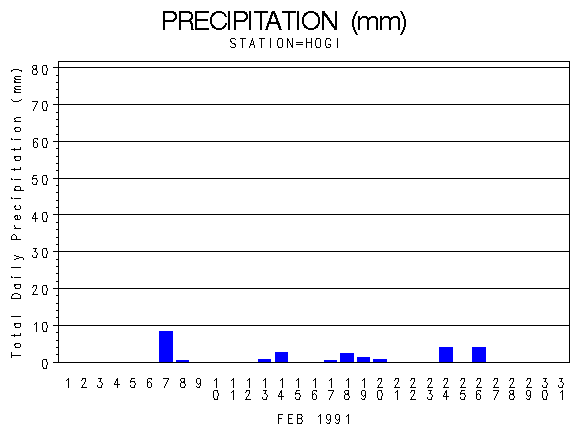 |
| Daily Total Precipitation (mm) |

 |
| Hourly Mean Temperatures (deg. C) |
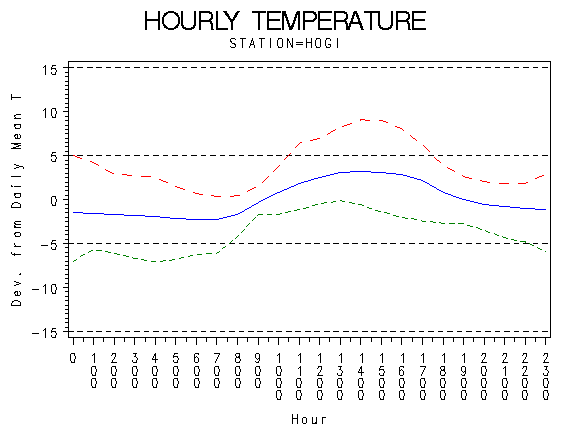 |
| Hourly Max Min and Mean Temperatures (deg. C) |
 |
| Wind Speed (m/s) |
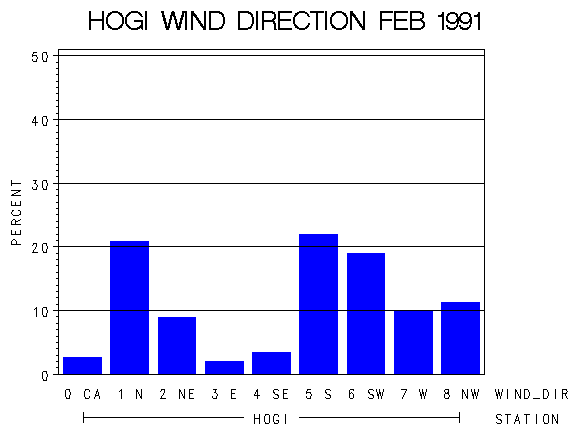 |
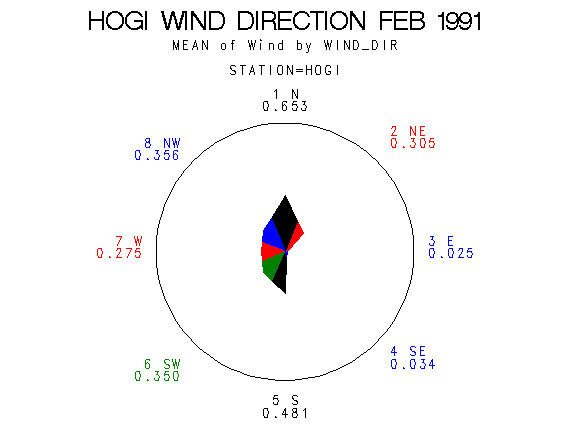
| Frequency of Wind Direction |
 |
| Wind Vectors (circle=1.5 m/s) |
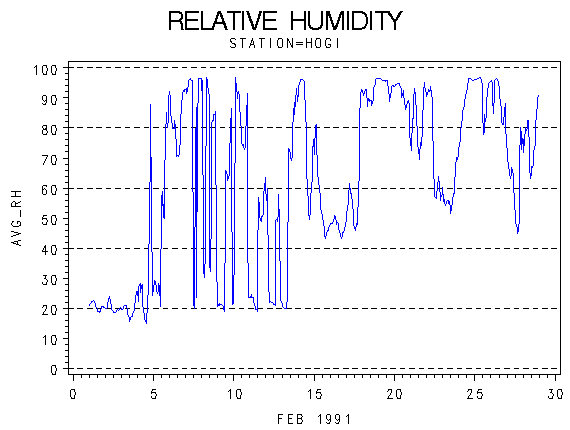 |
| Relative Humidity (percent) |
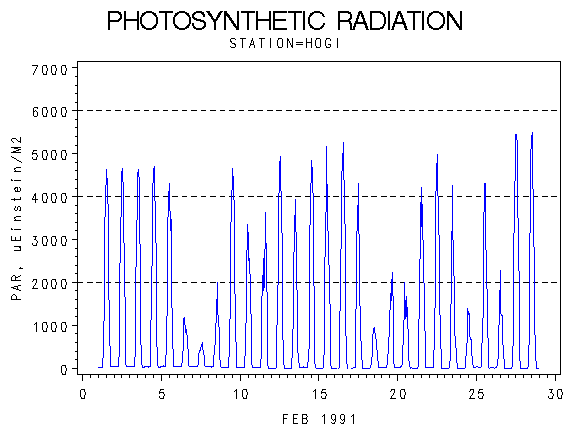 |
| Photosynthetically Active Radiation (micro-einsteins per m squared) |
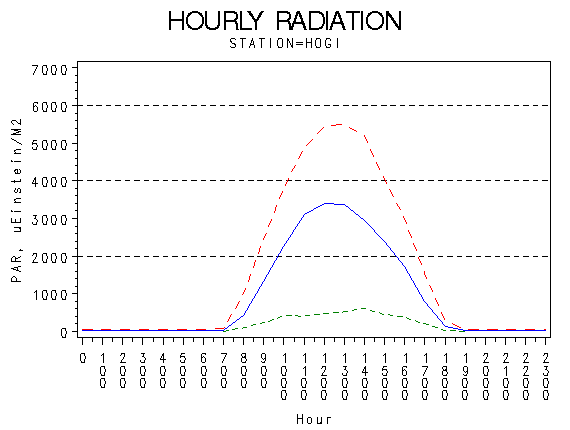 |
| Hourly Photosynthetically Active Radiation (micro-einsteins per m squared) |
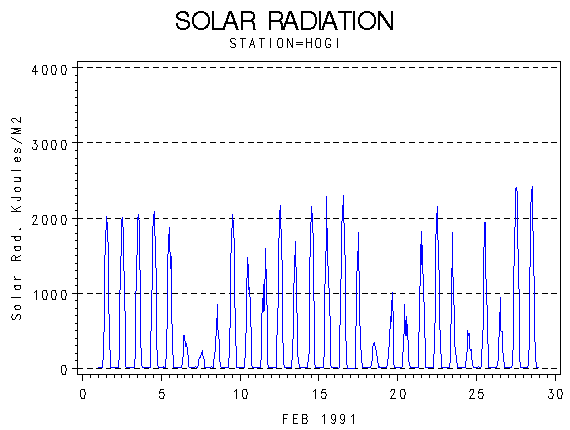 |
| Solar Radiation (KiloJoules per Meter Squared) |
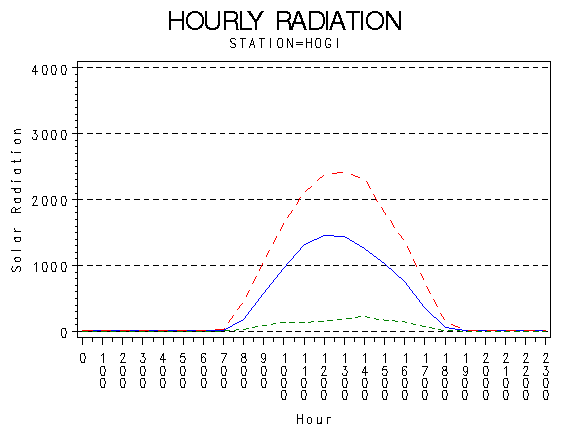 |
| Hourly Solar Radiation (KiloJoules per Meter Squared) |
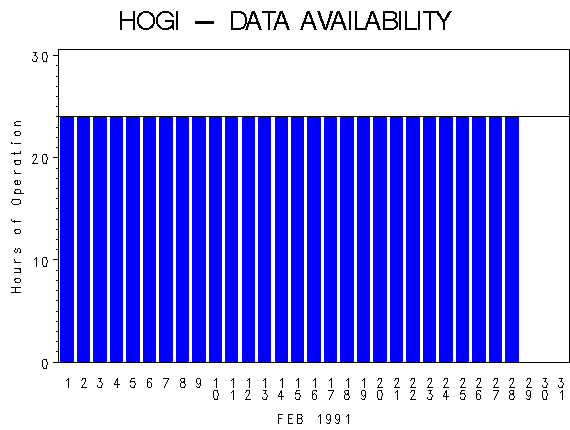 |
| Hours of Station Operation |
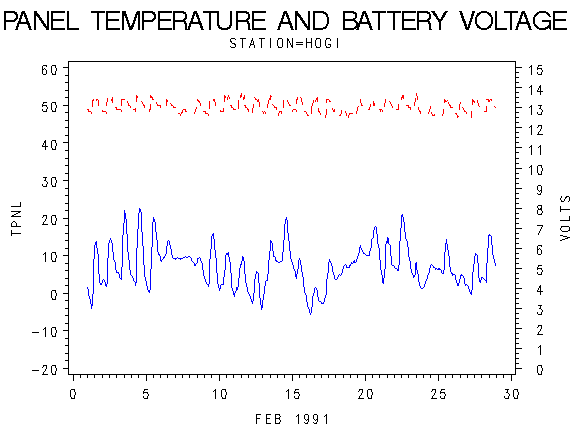 |
| Data Logger Battery Voltage and Internal Logger Temperature |