

| VIRGINIA COAST RESERVE LONG-TERM ECOLOGICAL RESEARCH |
Site HOGI, Month JUL, Year 1990 |

| 
|
| Day of Month | Precip (mm) | Max Temp. oC | Min Temp. oC | Mean Temp. oC | Wind Speed (m/s) | Wind Dir (deg.) | Vapor Press. (mb) | Solar Rad. KJ/m2 | PAR uE/m2 |
|---|---|---|---|---|---|---|---|---|---|
| 1 | 10.00 | 31 | 19 | 24.9 | 2.47 | 301 | 19.90 | 22285 | 54900 |
| 2 | 0.30 | 27 | 19 | 22.1 | 3.02 | 4 | 17.37 | 19170 | 47066 |
| 3 | 0.00 | 27 | 16 | 22.2 | 1.98 | 173 | 16.59 | 26149 | 60478 |
| 4 | 0.00 | 33 | 21 | 26.6 | 2.74 | 225 | 20.96 | 24911 | 57994 |
| 5 | 0.00 | 36 | 23 | 28.8 | 2.12 | 239 | 22.94 | 24109 | 56253 |
| 6 | 0.00 | 31 | 22 | 24.5 | 1.93 | 50 | 22.11 | 21622 | 51304 |
| 7 | 0.00 | 26 | 22 | 23.2 | 2.85 | 77 | 17.64 | 18481 | 44198 |
| 8 | 0.00 | 29 | 22 | 24.8 | 2.63 | 146 | 20.98 | 20720 | 50076 |
| 9 | 4.10 | 33 | 24 | 27.2 | 2.72 | 204 | 25.28 | 22445 | 52634 |
| 10 | 0.30 | 36 | 26 | 29.4 | 1.90 | 232 | 25.38 | 23006 | 53903 |
| 11 | 62.00 | 33 | 22 | 26.7 | 2.35 | 210 | 24.06 | 22747 | 53327 |
| 12 | 11.90 | 34 | 22 | 27.0 | 2.85 | 214 | 24.82 | 24091 | 55524 |
| 13 | 0.00 | 29 | 24 | 25.7 | 2.09 | 198 | 23.00 | 13796 | 34552 |
| 14 | 0.00 | 31 | 24 | 27.0 | 2.31 | 155 | 25.27 | 23238 | 56013 |
| 15 | 0.00 | 29 | 24 | 26.1 | 3.48 | 190 | 23.80 | 19300 | 47319 |
| 16 | 0.00 | 31 | 23 | 26.7 | 1.51 | 181 | 22.48 | 23064 | 53842 |
| 17 | 3.80 | 30 | 23 | 25.3 | 1.37 | 205 | 22.40 | 15672 | 37488 |
| 18 | 0.00 | 29 | 22 | 25.4 | 1.83 | 187 | 22.29 | 24361 | 55881 |
| 19 | 0.00 | 32 | 23 | 26.3 | 2.01 | 198 | 23.68 | 20635 | 48450 |
| 20 | 0.00 | 31 | 24 | 27.0 | 2.10 | 206 | 23.19 | 22561 | 53445 |
| 21 | 0.00 | 34 | 23 | 27.4 | 2.25 | 227 | 22.82 | 24821 | 58869 |
| 22 | 3.80 | 31 | 21 | 26.2 | 1.46 | 168 | 23.69 | 23802 | 54745 |
| 23 | 0.00 | 31 | 24 | 26.7 | 2.38 | 191 | 24.07 | 24709 | 57009 |
| 24 | 0.00 | 30 | 21 | 25.0 | 2.31 | 24 | 20.66 | 17942 | 42417 |
| 25 | 0.00 | 29 | 21 | 24.5 | 1.62 | 48 | 20.13 | 23845 | 55335 |
| 26 | 0.00 | 28 | 21 | 24.6 | 3.64 | 34 | 20.73 | 23695 | 55571 |
| 27 | 0.00 | 24 | 23 | 23.4 | 2.58 | 18 | 21.14 | 718 | 661 |
| Mon. Tot. Precip. 96.2 mm | Mean wind vel. 2.315 m/s |
| Mon. Mean Temp. 25.7 deg. C | Wind dir 186 deg |
| Mean Max. Temp. 30.5 deg. C | Mean Min. Temp. 22.2 deg. C |
| Extreme Max. Temp 36.4 deg. C | Mean vapor press 22.12 mb |
| Extreme Min. Temp 15.7 deg. C | Total Solar Rad 571893 KJ/sq. m |
| Total photosyn. 1349253 uEin/sq.m |
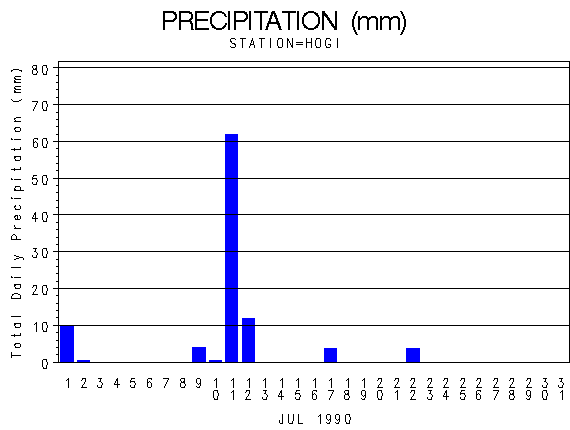 |
| Daily Total Precipitation (mm) |

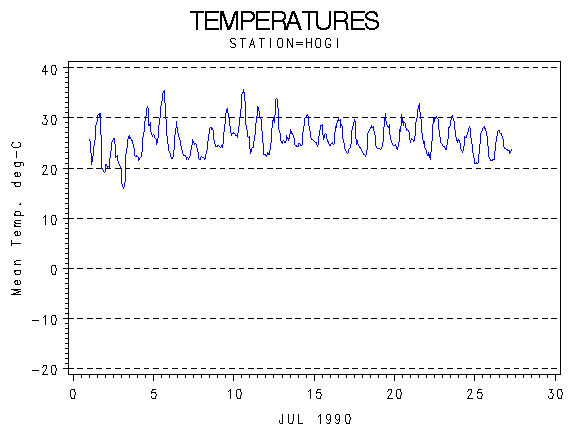 |
| Hourly Mean Temperatures (deg. C) |

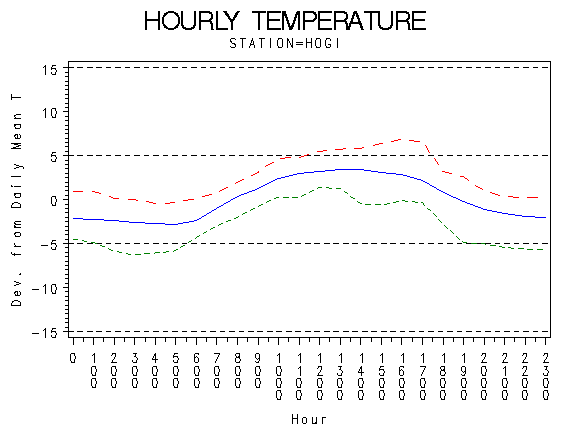 |
| Hourly Max Min and Mean Temperatures (deg. C) |

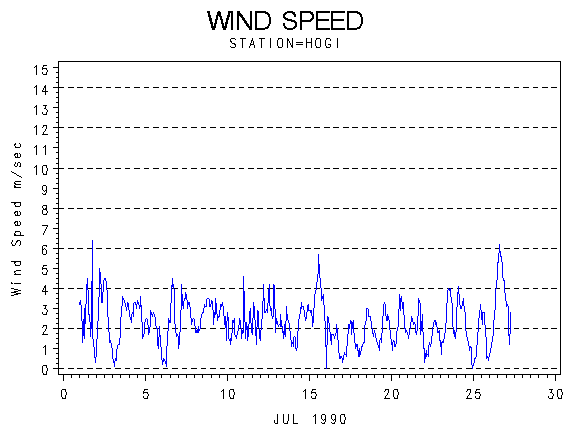 |
| Wind Speed (m/s) |

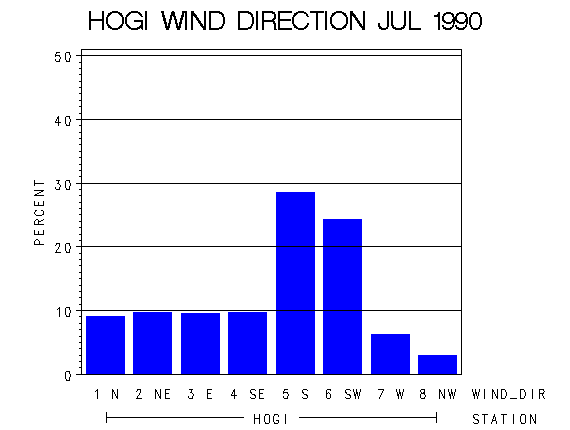 |
| Frequency of Wind Direction |

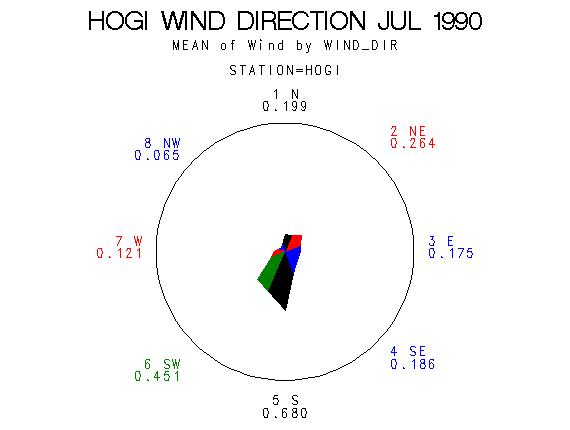 |
| Wind Vectors (circle=1.5 m/s) |

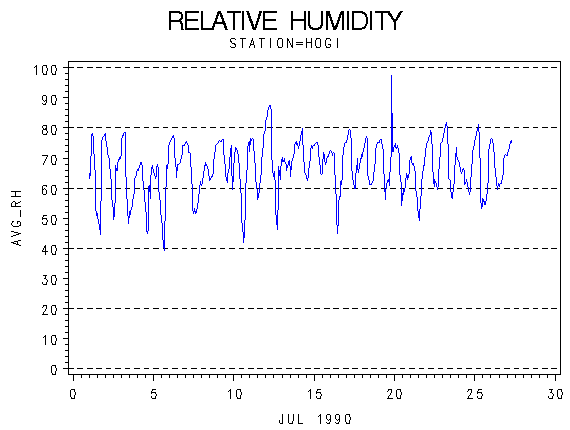 |
| Relative Humidity (percent) |

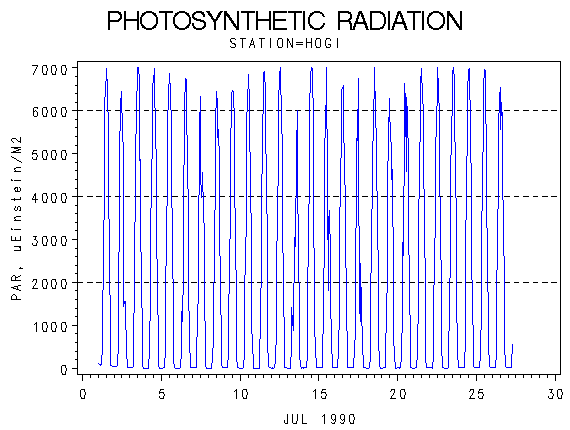 |
| Photosynthetically Active Radiation (micro-einsteins per m squared) |

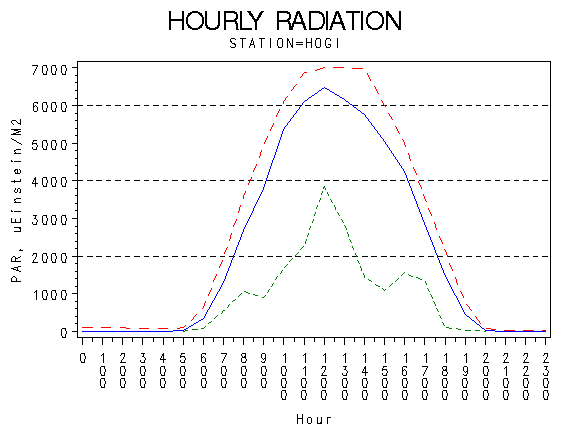 |
| Hourly Photosynthetically Active Radiation (micro-einsteins per m squared) |

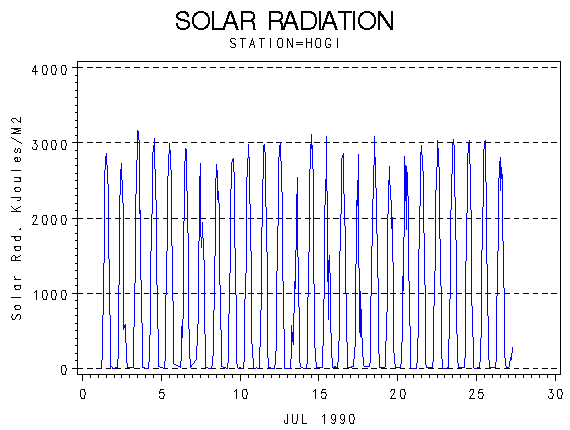 |
| Solar Radiation (KiloJoules per Meter Squared) |

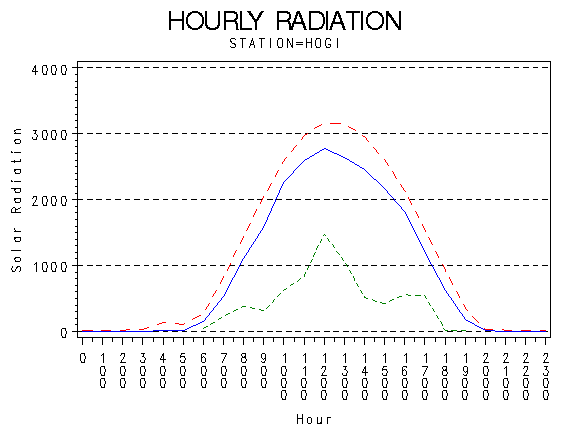 |
| Hourly Solar Radiation (KiloJoules per Meter Squared) |

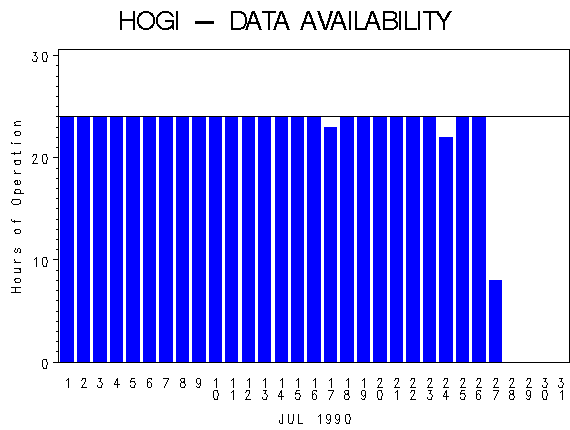 |
| Hours of Station Operation |

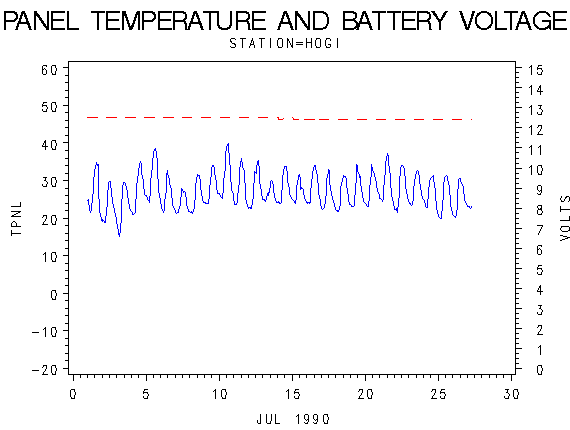 |
| Data Logger Battery Voltage and Internal Logger Temperature |
