

| VIRGINIA COAST RESERVE LONG-TERM ECOLOGICAL RESEARCH |
Site HOGI, Month MAY, Year 1990 |

| 
|
| Day of Month | Precip (mm) | Max Temp. oC | Min Temp. oC | Mean Temp. oC | Wind Speed (m/s) | Wind Dir (deg.) | Vapor Press. (mb) | Solar Rad. KJ/m2 | PAR uE/m2 |
|---|---|---|---|---|---|---|---|---|---|
| 1 | 0.00 | 20 | 13 | 16.2 | 1.85 | 152 | 14.27 | 18528 | 41640 |
| 2 | 0.00 | 21 | 13 | 17.8 | 2.70 | 21 | 11.66 | 13140 | 32079 |
| 3 | 0.00 | 17 | 14 | 15.3 | 2.64 | 77 | 10.39 | 7778 | 20291 |
| 4 | 0.00 | 19 | 14 | 15.6 | 2.48 | 80 | 13.32 | 10850 | 27574 |
| 5 | 22.70 | 26 | 16 | 20.6 | 3.68 | 235 | 18.11 | 15377 | 35062 |
| 6 | 0.00 | 19 | 13 | 15.5 | 4.08 | 323 | 10.82 | 23367 | 50199 |
| 7 | 2.30 | 22 | 11 | 16.3 | 3.07 | 287 | 10.11 | 26522 | 56945 |
| 8 | 0.00 | 26 | 15 | 19.5 | 2.61 | 216 | 12.63 | 26466 | 58526 |
| 9 | 0.00 | 25 | 17 | 19.7 | 3.34 | 204 | 15.61 | 19642 | 45616 |
| 10 | 19.30 | 21 | 15 | 18.1 | 4.74 | 185 | 16.10 | 9335 | 23013 |
| 11 | 0.00 | 21 | 13 | 16.5 | 3.72 | 276 | 9.26 | 27146 | 57600 |
| 12 | 0.60 | 17 | 13 | 15.1 | 3.22 | 98 | 11.64 | 14772 | 35420 |
| 13 | 0.00 | 21 | 16 | 18.3 | 3.58 | 184 | 15.90 | 12340 | 31006 |
| 14 | 0.00 | 20 | 13 | 16.9 | 2.94 | 28 | 13.53 | 20478 | 48128 |
| 15 | 1.50 | 20 | 13 | 16.2 | 4.48 | 150 | 13.03 | 22247 | 51460 |
| 16 | 0.00 | 23 | 16 | 19.5 | 10.95 | 192 | 17.07 | 22216 | 52271 |
| 17 | 0.00 | 29 | 19 | 24.1 | 9.13 | 232 | 19.67 | 17861 | 43206 |
| 18 | 0.00 | 25 | 16 | 21.1 | 10.03 | 274 | 9.79 | 26556 | 58503 |
| 19 | 0.00 | 28 | 16 | 21.4 | 7.29 | 254 | 12.15 | 26331 | 59342 |
| 20 | 2.00 | 26 | 19 | 21.1 | 7.82 | 209 | 16.47 | 14933 | 36479 |
| 21 | 0.30 | 24 | 13 | 18.0 | 11.27 | 28 | 16.18 | 12396 | 29810 |
| 22 | 5.20 | 14 | 11 | 12.0 | 16.54 | 52 | 10.26 | 7135 | 20160 |
| 23 | 0.00 | 20 | 10 | 14.8 | 6.90 | 355 | 10.43 | 21521 | 47699 |
| 24 | 0.00 | 24 | 12 | 17.6 | 5.93 | 297 | 12.15 | 23346 | 52542 |
| 25 | 1.80 | 23 | 11 | 17.8 | 2.21 | 182 | 14.27 | 25455 | 56891 |
| 26 | 43.50 | 26 | 15 | 18.9 | 2.85 | 199 | 16.33 | 9005 | 21402 |
| 27 | 27.80 | 18 | 13 | 15.2 | 2.84 | 41 | 13.63 | 6056 | 14583 |
| 28 | 0.00 | 17 | 13 | 15.2 | 2.55 | 85 | 13.01 | 11248 | 26202 |
| 29 | 22.10 | 22 | 16 | 17.7 | 3.67 | 271 | 15.70 | 11616 | 25803 |
| 30 | 0.00 | 22 | 13 | 17.4 | 4.49 | 330 | 11.63 | 24556 | 53188 |
| 31 | 0.00 | 21 | 13 | 16.8 | 2.17 | 113 | 10.38 | 26148 | 57946 |
| Mon. Tot. Precip. 149.1 mm | Mean wind vel. 5.024 m/s |
| Mon. Mean Temp. 17.6 deg. C | Wind dir 234 deg |
| Mean Max. Temp. 21.8 deg. C | Mean Min. Temp. 14.0 deg. C |
| Extreme Max. Temp 28.9 deg. C | Mean vapor press 13.40 mb |
| Extreme Min. Temp 9.6 deg. C | Total Solar Rad 554364 KJ/sq. m |
| Total photosyn. 1270585 uEin/sq.m |
 |
| Daily Total Precipitation (mm) |

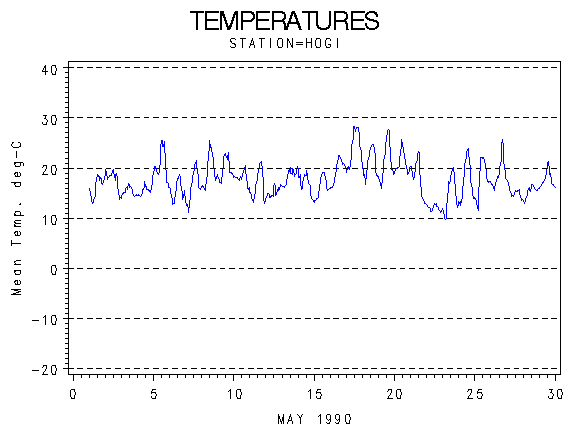 |
| Hourly Mean Temperatures (deg. C) |

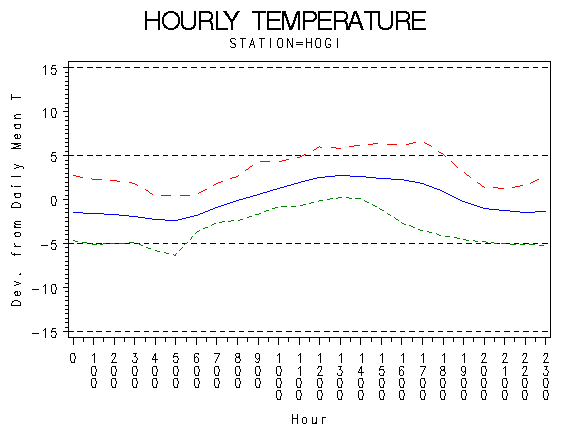 |
| Hourly Max Min and Mean Temperatures (deg. C) |

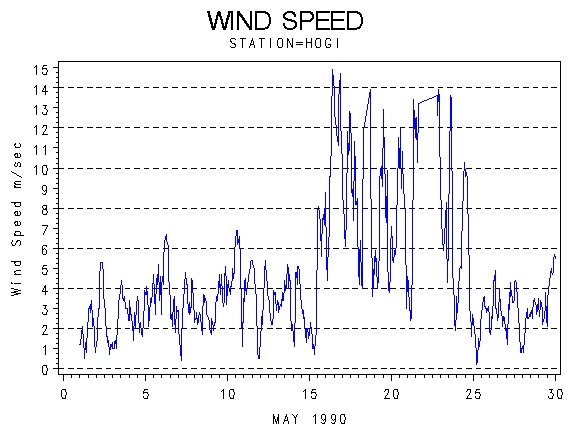 |
| Wind Speed (m/s) |

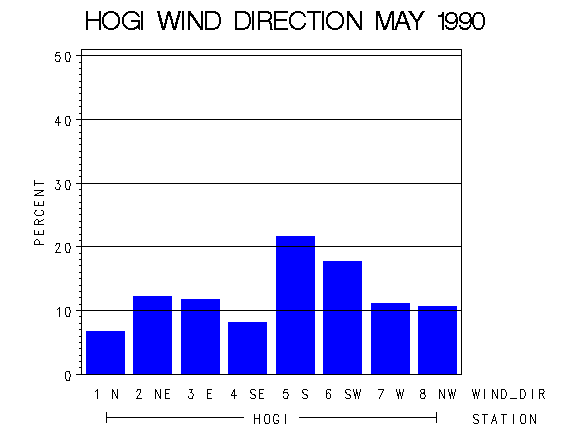 |
| Frequency of Wind Direction |

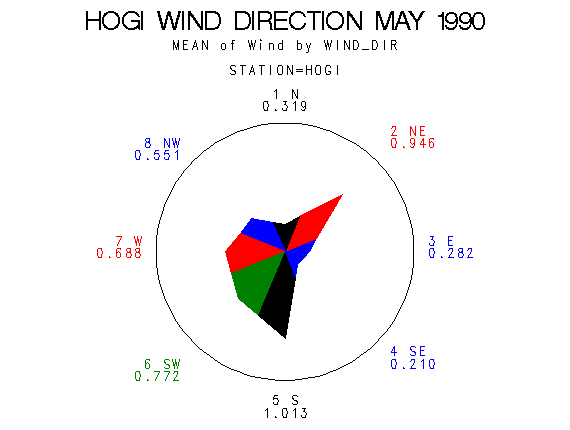 |
| Wind Vectors (circle=1.5 m/s) |

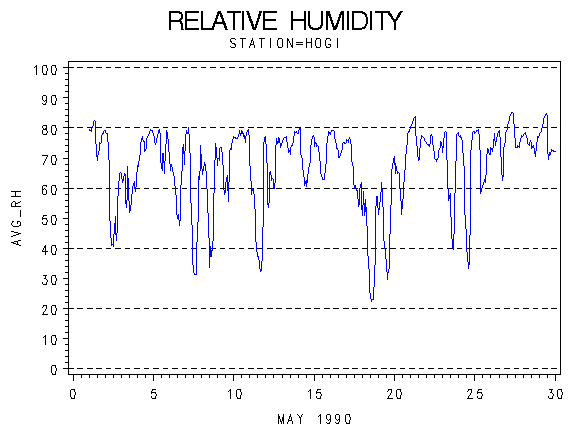 |
| Relative Humidity (percent) |

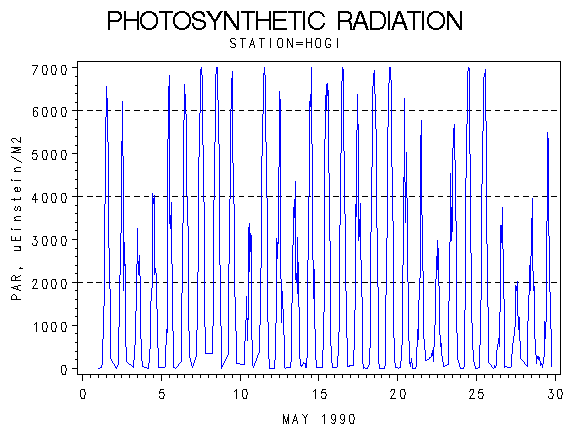 |
| Photosynthetically Active Radiation (micro-einsteins per m squared) |

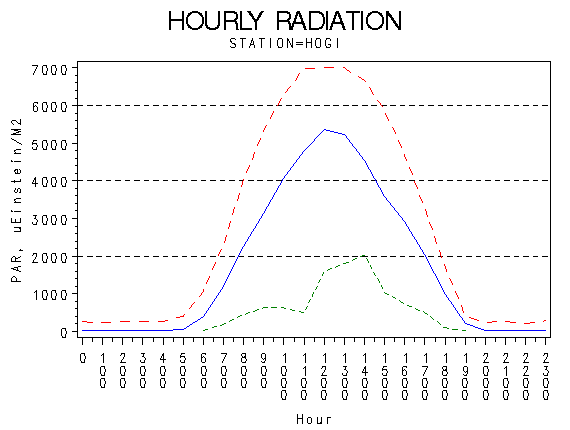 |
| Hourly Photosynthetically Active Radiation (micro-einsteins per m squared) |

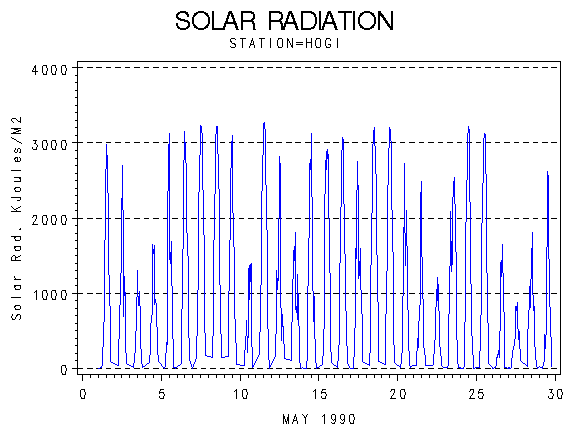 |
| Solar Radiation (KiloJoules per Meter Squared) |

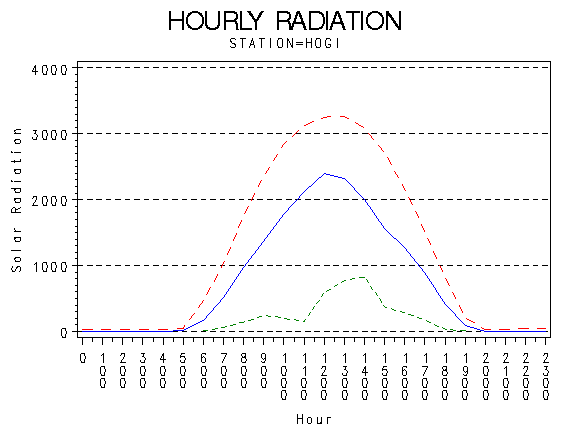 |
| Hourly Solar Radiation (KiloJoules per Meter Squared) |

 |
| Hours of Station Operation |

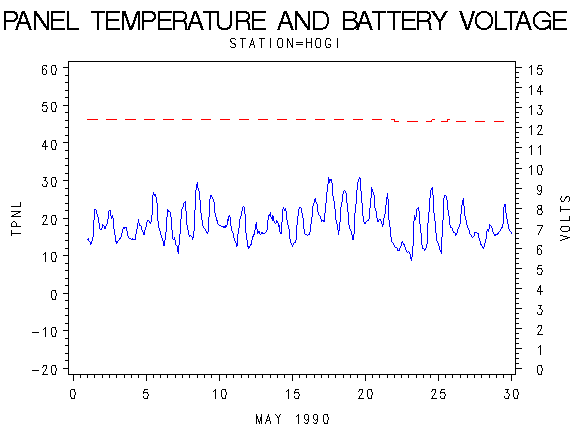 |
| Data Logger Battery Voltage and Internal Logger Temperature |
