
|
| VIRGINIA COAST RESERVE LONG-TERM ECOLOGICAL RESEARCH |
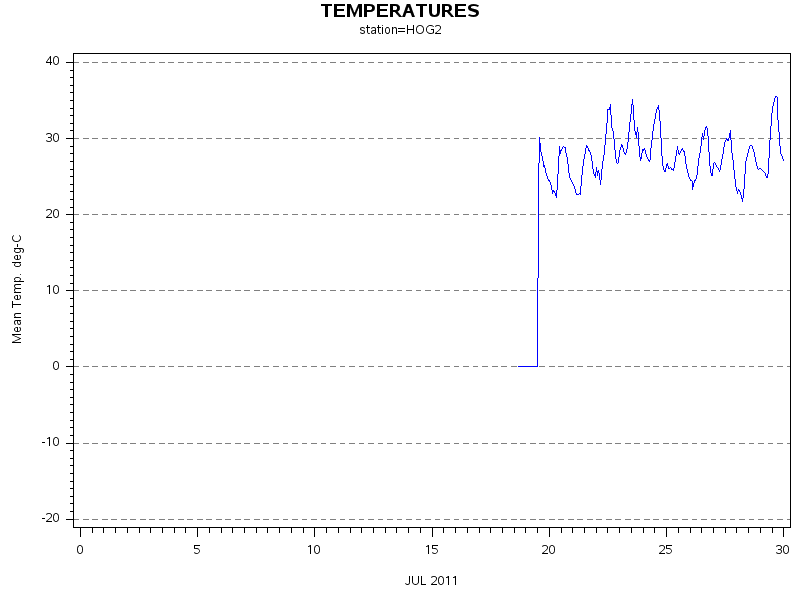
Site HOG2, Month JUL, Year 2011 |

| 
|
| Day of Month | Precip (mm) | Max Temp. oC | Min Temp. oC | Mean Temp. oC | Wind Speed (m/s) | Wind Dir (deg.) | Vapor Press. (mb) | Solar Rad. KJ/m2 | PAR mMoles/m2 |
|---|---|---|---|---|---|---|---|---|---|
| 18 | 0.00 | 0 | 0 | 0.0 | 0.00 | 0 | . | . | . |
| 19 | 0.03 | 31 | 0 | 12.1 | 0.72 | 196 | 26.69 | . | . |
| 20 | 0.08 | 30 | 22 | 25.9 | 1.40 | 179 | 27.99 | . | . |
| 21 | 0.00 | 30 | 22 | 25.6 | 1.85 | 179 | 29.13 | . | . |
| 22 | 0.00 | 35 | 24 | 28.9 | 1.84 | 214 | 31.21 | . | . |
| 23 | 0.00 | 36 | 27 | 29.9 | 2.10 | 227 | 30.14 | . | . |
| 24 | 0.00 | 35 | 25 | 29.4 | 1.72 | 279 | 29.60 | . | . |
| 25 | 4.86 | 30 | 25 | 27.0 | 1.80 | 232 | 28.90 | . | . |
| 26 | 0.03 | 32 | 23 | 27.1 | 1.82 | 291 | 27.67 | . | . |
| 27 | 0.00 | 32 | 24 | 27.5 | 1.68 | 244 | 25.61 | . | . |
| 28 | 0.01 | 30 | 21 | 25.8 | 1.52 | 151 | 28.14 | . | . |
| 29 | 0.00 | 36 | 25 | 29.6 | 1.65 | 227 | 29.35 | . | . |
| 30 | 0.00 | 31 | 24 | 28.1 | 1.74 | 165 | 26.38 | . | . |
| 31 | 0.00 | 29 | 23 | 26.4 | 1.21 | 201 | 26.59 | . | . |
| Mon. Tot. Precip. 5.0 mm | Mean wind vel. 1.503 m/s |
| Mon. Mean Temp. 24.5 deg. C | Wind dir 211 deg |
| Mean Max. Temp. 29.7 deg. C | Mean Min. Temp. 20.4 deg. C |
| Extreme Max. Temp 35.9 deg. C | Mean vapor press 28.26 mb |
| Extreme Min. Temp 0.0 deg. C | Total Solar Rad . KJ/sq. m |
| Total photosyn. . mMoles/sq.m |
 |
| Daily Total Precipitation (mm) |

 |
| Hourly Mean Temperatures (deg. C) |
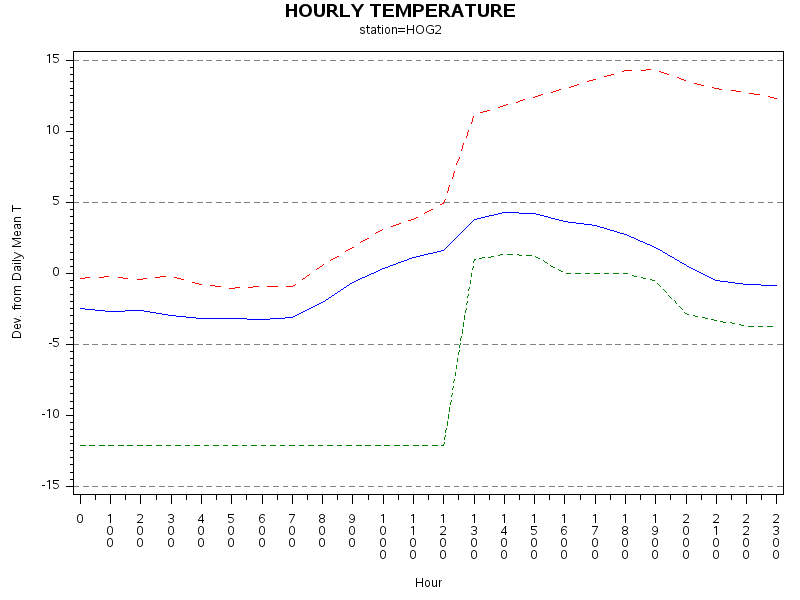 |
| Hourly Max Min and Mean Temperatures (deg. C) |
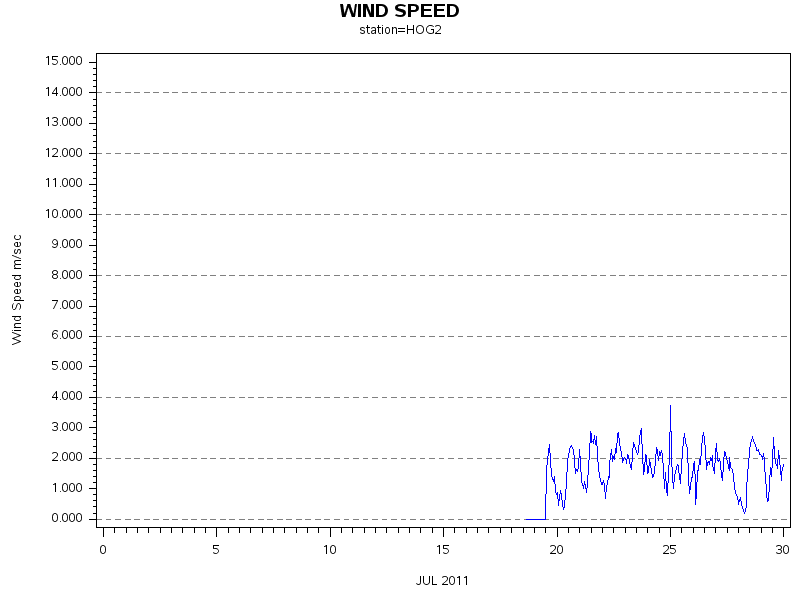 |
| Wind Speed (m/s) |
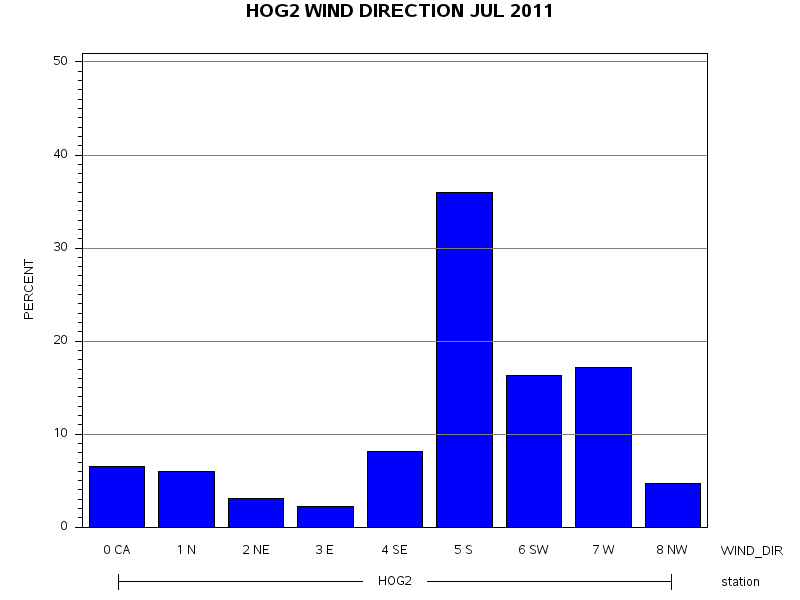 |
| Frequency of Wind Direction |
 |
| Wind Vectors (circle=1.5 m/s) |
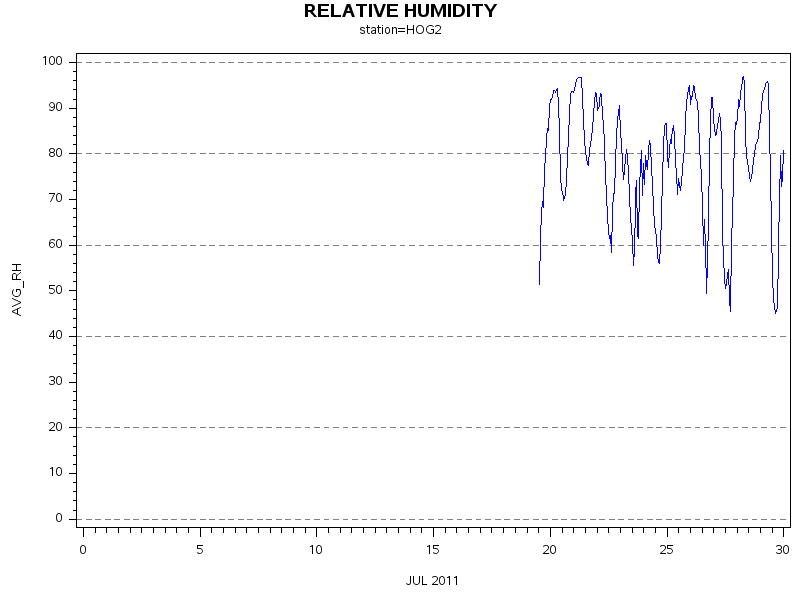 |
| Relative Humidity (percent) |
 |
| Photosynthetically Active Radiation (milli-moles per m squared) |
 |
| Hourly Photosynthetically Active Radiation (milliMoles per m squared) |
 |
| Solar Radiation (KiloJoules per Meter Squared) |
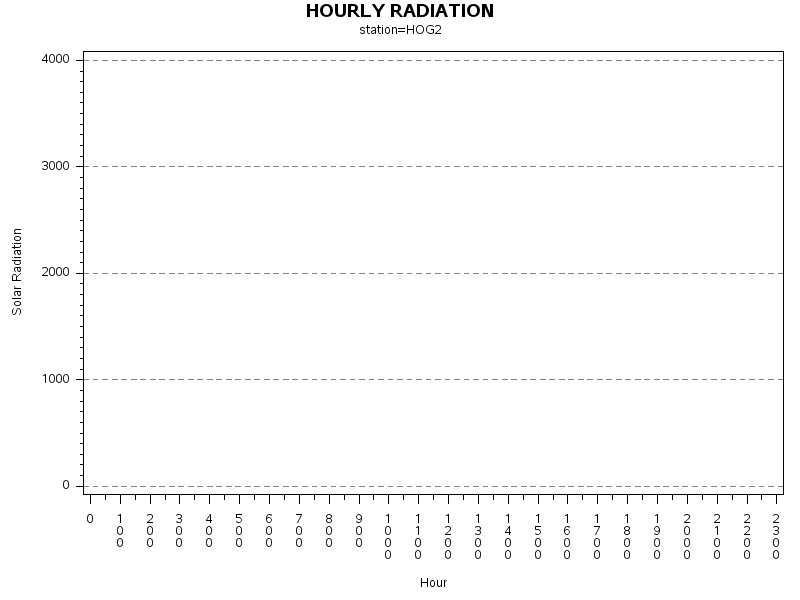 |
| Hourly Solar Radiation (KiloJoules per Meter Squared) |
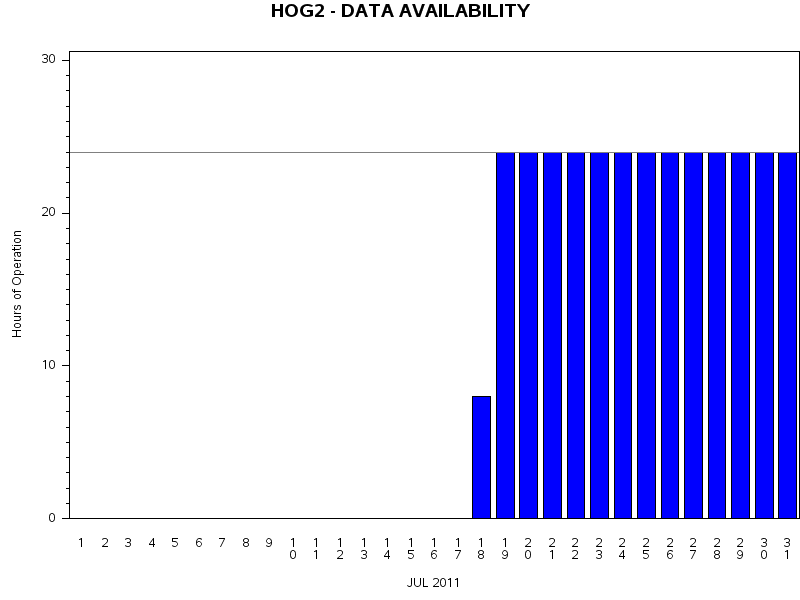 |
| Hours of Station Operation |
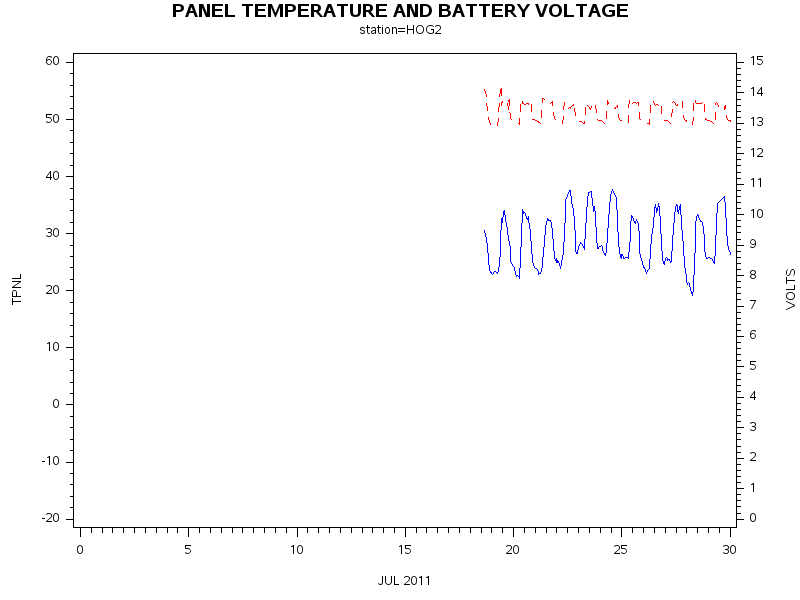 |
| Data Logger Battery Voltage and Internal Logger Temperature |